 Goran Štimac
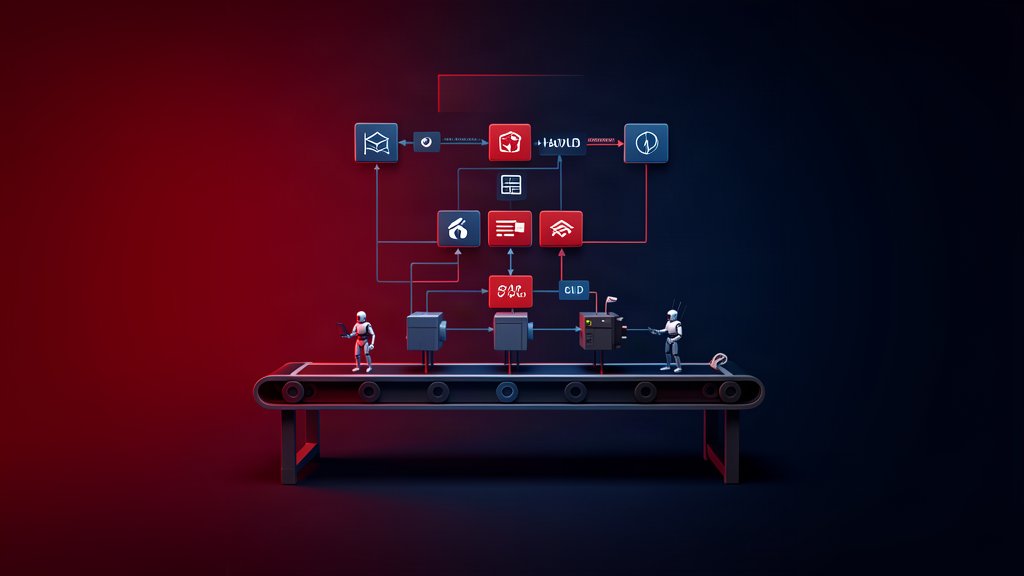
Two dates mark the shift. On 2026-05-21 the CNCF announced OpenTelemetry’s graduation, its highest maturity level, making the project the de facto standard for telemetry collection. Since Prometheus 3.0 (2024-11-14) the metric server has spoken OTLP natively and accepted UTF-8 metric names without translation. The stack no longer changes tool-by-tool. It consolidated around one vendor-neutral pipeline, one metric server, and one front end that treats dashboards and alerts as code.
OpenTelemetry Is the Default Layer
The graduation release reports 12,000+ contributors from 2,800+ companies, and CNCF ranks the project’s velocity second only to Kubernetes. Adoption data from the CNCF 2025 Annual Survey (published January 2026, data collected September 2025) shows OpenTelemetry at 49% production use with another 26% evaluating — a number that predates graduation and has likely grown since. Logs, metrics, and traces have been stable signals in the specification since 2023; continuous profiling is the new signal, still in public alpha since 2026-03-26.
The practical consequence is interchangeable backends. Apps emit OTLP to a Collector, which makes swapping backends cheap: moving from Prometheus to Mimir, or from Grafana Cloud to a self-hosted LGTM stack, no longer means re-instrumenting services. OTel does not remove the monitoring decision; it removes the lock-in that used to make it expensive. The trade-off is a new operational layer: you now run a Collector fleet with its own memory limits, batching, and upgrade cadence. A minimal pipeline from the Collector configuration docs looks like this:
receivers:
  otlp:
    protocols:
      grpc:
        endpoint: 0.0.0.0:4317
      http:
        endpoint: 0.0.0.0:4318
processors:
  memory_limiter:
    check_interval: 1s
    limit_mib: 512
  batch: {}
exporters:
  otlp:
    endpoint: backend.example.com:4317
    tls:
      insecure: false
service:
  pipelines:
    traces:
      receivers: [otlp]
      processors: [memory_limiter, batch]
      exporters: [otlp]
    metrics:
      receivers: [otlp]
      processors: [memory_limiter, batch]
      exporters: [otlp]
    logs:
      receivers: [otlp]
      processors: [memory_limiter, batch]
      exporters: [otlp]
The Collector sits beside services so applications offload quickly, while batching, retries, filtering, and sensitive-data scrubbing happen centrally. otelcol validate --config=config.yaml checks the file before you apply it.
Metrics: Prometheus 3.x Made OTLP Native
Prometheus 3.0 was the first major release in seven years. UTF-8 metric and label names are the default, so OpenTelemetry semantic conventions no longer need a dots-to-underscores rewrite. Prometheus now acts as an OTLP receiver on /api/v1/otlp/v1/metrics, and Remote Write 2.0 carries metadata, exemplars, and created timestamps. Native histograms remain experimental behind --enable-feature=native-histograms. Current stable is v3.13.2 (2026-07-30); upgrading via 2.55 is the supported migration path.
Cardinality control is built into the scrape config. Two mechanisms from the configuration docs cover most cases:
# prometheus.yml — scrape Kubernetes pods, cap per-scrape samples, drop noisy labels
global:
  scrape_interval: 30s
  evaluation_interval: 30s

scrape_configs:
  - job_name: "kubernetes-pods"
    kubernetes_sd_configs:
      - role: pod
    relabel_configs:
      - source_labels: [__meta_kubernetes_pod_label_app]
        target_label: app
    metric_relabel_configs:
      - source_labels: [pod_ip]        # drop unbounded labels early: cardinality control
        regex: ".+"
        action: drop
    sample_limit: 5000                  # hard cap per scrape (cardinality/cost brake)
# rules.yml — recording rule: precompute a dashboard-hot query once per evaluation
groups:
- name: api-slos
interval: 30s
rules:
- record: job:http_requests:rate5m
expr: sum by (job) (rate(http_requests_total[5m]))The first snippet drops unbounded labels at scrape time and caps per-target series with sample_limit. The second precomputes a hot dashboard query as a recording rule, per the recording rules docs. Recording rules trade a small amount of storage for dramatically cheaper dashboards, and promtool check rules rules.yml validates the syntax before reload.
Logs and Traces: OTLP as the Lingua Franca
Loki 3.0 (2024-04-10) introduced Bloom filters for faster log search and native OTLP ingestion, making structured logs labeled like metrics the default pattern. Traces are the most mature signal: Tempo and Grafana Cloud Traces are OTLP-native, and correlation is the interesting part — exemplars connect a metric sample to a trace, profile samples carry trace_id and span_id, and logs share resource attributes with both. The change in 2026 is not a new format; it is that all four signals finally ride the same wire and the same attribute vocabulary.
Alerting: From Alertmanager-Only to a Managed Workflow
Grafana 12 (2025-05-08) made Grafana-managed alerts and recording rules generally available: rules evaluated inside Grafana across multiple data sources, not just Prometheus. The fundamentals page defines the workflow: one query plus a threshold produces multi-dimensional alert instances (one per series), instances move pending to firing on the evaluation schedule, contact points carry notifications (email, Slack, webhook, PagerDuty), and the notification policy tree routes and groups them. Silences cover maintenance windows; mute timings handle recurring quiet periods.
The trade-off is the choice of evaluation engine. Prometheus rules still route to Alertmanager, and rule groups support for, keep_firing_for, and limit. Grafana-managed rules win when your sources are heterogeneous; Prometheus-side rules stay natural when Prometheus is the single source of truth. Most teams end up with both, which is why the alerting pipeline is now a design decision rather than a default. For the process around the pager, our incident-response playbooks post covers the operational side.
Dashboards and SLOs as Code
Grafana 13.0 (April 2026) shipped the two observability-as-code features to GA: Dynamic Dashboards (2026-04-08) and Git Sync (2026-04-20). Git Sync pushes dashboards and folders to GitHub, GitLab, or Bitbucket, so edits in the UI become commits and pull requests without leaving Grafana. The trade-off is process: review gates protect production dashboards, but a broken dashboard can no longer be hotfixed by one click. Dynamic Dashboards replaces hand-built layouts with tabs, conditional rendering, and an auto-grid; existing dashboards auto-migrate, which is a change most teams feel before they read the release notes.
Profiles and eBPF: The Next Signal Is Still Alpha
Continuous profiling entered public alpha on 2026-03-26, with an OTLP Profiles data model, pprof round-trip compatibility, and a reference eBPF profiler donated by Elastic. OpenTelemetry eBPF Instrumentation (OBI), the Grafana Beyla donation, shipped its first alpha on 2025-11-03: protocol-level, out-of-process capture of RED metrics, service graphs, and traces for HTTP/2, gRPC, SQL, Redis, Kafka, and more — no code changes, no restarts. The official guidance is unambiguous: alpha tooling is not for critical production workloads, and production-ready profiling backends have not yet emerged. Plan to evaluate, not to adopt.
Cardinality and Cost: The 2026 Discipline
The Grafana cardinality reference (2022, still canonical) defines the problem: cardinality is the cartesian product of metrics and label values. A node exporter produces about 500 series by default, mysqld exporter about 1,000, and one unbounded label like user_id or session_id multiplies that into millions. Kubernetes ephemeral workloads make it worse, because every pod state change can create a new series.
The levers are all in the configuration surface: metric_relabel_configs and the per-scrape sample_limit, label_limit, and target_limit; recording rules that aggregate and drop detail; rule-group limits. Mimir, the OSS long-term store, documents horizontal scale to a billion active series. Grafana Labs’ 2026 trends post predicts data value will overtake data volume, with its Adaptive Telemetry filtering 50–80% of telemetry — a vendor product claim, not an independent measurement. The discipline itself is real: the team that controls cardinality controls the bill.
Managed vs Self-Hosted: The Decision Hasn’t Changed
The hosted-versus-self-hosted trade-off is covered in depth in our companion post. Two numbers frame it: Prometheus at 77% production use (CNCF 2025 survey) makes self-hosted metrics mainstream, while OTel’s vendor-neutral layer makes switching backends cheap either way. The decision still comes down to control versus operational burden — nothing in 2026 removed that trade-off.
What Comes Next (Forecast)
Everything from here is projection, not shipped capability. Grafana Labs predicts AI will move from copilot to collaborator, with 84% of organizations having explored or piloted AI in observability in 2025 and a Gartner projection that one-third of generative-AI interactions will involve autonomous agents by 2028. Model SLOs such as prediction freshness or hallucination rate are forecasts, not products; our guide to AI agent observability covers what production agents actually need logged, traced, and alerted on. A FinOps Foundation figure cited by Grafana Labs puts European carbon reporting at 53%, up ten points year over year, which could make carbon an SLO. Profiling GA is the most concrete near-term milestone, and OBI’s path toward beta is the one to watch.
Closing
The 2026 stack is standardized and code-driven: OTLP everywhere, Prometheus 3.x as the OTLP-native metric server, Grafana 13 as the GitOps’d front end, and cost-aware telemetry as the operating discipline. The remaining frontier — continuous profiling and zero-code eBPF instrumentation — is real but alpha. The skill that separates strong teams now is not collecting more data; it is choosing what to keep.
Related areas
Related What I Do
These What I Do pages are matched from the subject matter of this article, creating a cleaner path from educational content to implementation work.
Continue reading
Related articles
Based on shared categories first, then the strongest overlap in tags.