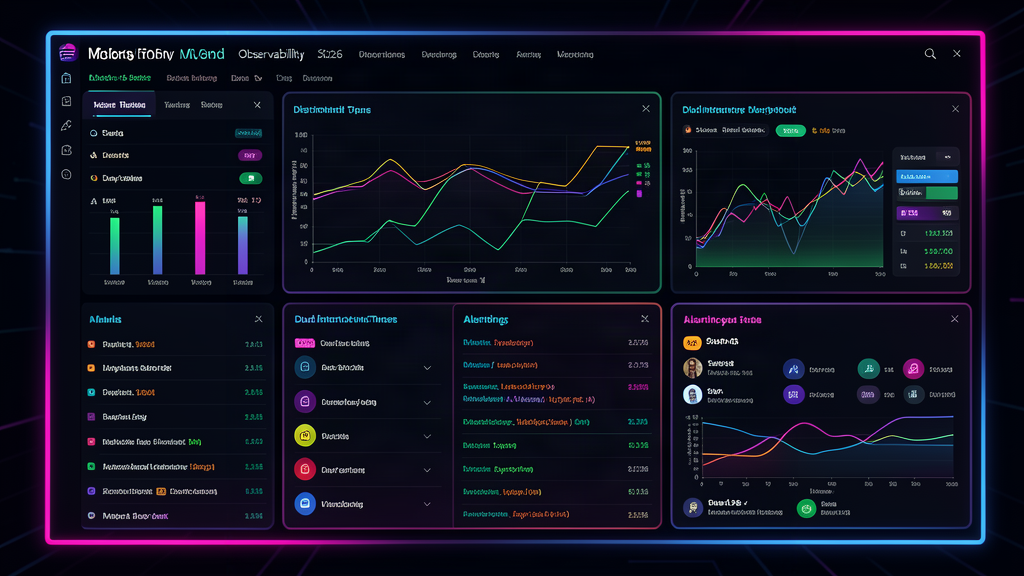

The first time an AI agent mishandles a production request — approves a refund it should have escalated, hallucinates a product’s return policy, or burns through $200 in tokens on a single session — your team realises the dashboard they built shows only token volumes and latency percentiles. Neither tells you what the agent actually did, why it did it, or whether the next run will repeat the same mistake.
Observability for AI agents is not APM with an LLM label added. Agents introduce decision traces that branch, tool calls that succeed or fail asynchronously, and output quality that cannot be reduced to a status code. This post defines the logging, tracing, and alerting surfaces that separate a manageable agent deployment from one where every incident starts with “we have no idea what happened.”
Run IDs and Trace Propagation
Every agent invocation needs a unique run ID that propagates through every sub-call the agent makes — model inference, tool execution, vector store query, and human handoff; without a stable trace root, correlating a user’s complaint with the specific sequence of agent decisions is manual guesswork.
What to log. The run ID sits in a structured log envelope alongside the agent version hash, the triggering event or user input, and the parent trace ID if this run was spawned by another agent. Every downstream call inherits the run ID as a baggage header or context key. The log entry for a tool call includes its run ID, the tool name, the arguments passed, the raw return value, the latency in milliseconds, and the call status (success, failure, timeout, or content-filter rejection).
OpenTelemetry semantic conventions for LLM calls are still maturing, but the practical approach in mid-2026 is to use a custom span attribute set on your OTel traces. Each agent span captures llm.model_id, llm.request.type (chat, completion, embedding, tool-use), llm.token.prompt, llm.token.completion, llm.finish_reason (stop, length, content_filter, tool_calls), and llm.temperature. Tool-call spans capture tool.name, tool.arguments, tool.result.truncated (set true when the return value exceeds 4 KB and is summarised before passing back to the model), and tool.duration_ms.
Why you need this. A user report of “the AI gave me wrong information” without trace propagation requires reviewing every log file from the incident window and guessing which calls belonged to which session. With trace propagation, you filter by run ID and reconstruct the exact sequence of model calls, tool invocations, and intermediate state that produced the erroneous output.
Tool-Call Latency Budgets
Tool calls are where AI agents break most often in production. A model call that takes two seconds is acceptable; a tool call that takes thirty seconds because the upstream API is slow causes the agent to stall, the user to reload the page, and the model to attempt fallback logic that may produce a worse outcome.
What to log per tool call. Record wall-clock latency, time-to-first-byte from the downstream service, and the number of retry attempts before success or failure. Log the full argument payload and the full return value (or a truncated representation when the return exceeds 4 KB) so you can replay the decision offline. Tag each tool call with the model’s finish_reason — a tool call initiated because the model decided to use it looks different from one initiated because the model was forced into tool-use mode by the application layer.
What to alert on. Set a P2 alert when any tool call exceeds 2× its p95 latency over a 5-minute window. Set a P1 when the tool-call success rate drops below 95 % for any individual tool in a rolling 10-minute window. A tool that succeeds 99 % of the time at p50 = 300 ms but has a 90th-percentile tail of 12 seconds is a reliability threat — users who hit the long tail see a frozen UI and the agent may time out its own thinking loop.
The tool-latency heatmap — grouped by tool name, time of day, and downstream API endpoint — reveals patterns the per-tool p95 hides. A spike in Slack API latency every hour on the hour is likely a cron-job collision on the workspace. A gradual increase in database-query tool latency over a week points to index bloat or unoptimised queries in the tool implementation.
Hallucination Detection Signals
Detecting hallucinated output in production without a human reading every response is the hardest observability problem AI agents face. You cannot log “hallucinated = true” — hallucination is a judgement, not a sensor reading. But you can log the signals that correlate with hallucination risk and alert when the risk crosses a threshold.
What to log. The model’s output logprobs for each token in the response — specifically the probability of the top token and the probability gap between the top two tokens. A narrowing gap between the most likely and second-most-likely tokens correlates with factual uncertainty in some model families. Log confidence scores from any external factuality classifier or consistency check you run: a self-consistency score (sampling the same prompt N times and measuring response agreement), a retrieval-groundedness score (what fraction of claims in the output have a supporting source in the retrieved context), and a contradiction flag (output contradicts known facts from a knowledge base).
What to alert on. A response with average top-token logprob below −0.5 and a self-consistency score below 0.6 across N=3 samples should trigger an automatic human-review escalation. Log the latent reason: “self-consistency low (0.5), logprob low (−0.8), no supporting retrieval context for 23 % of claims.” The escalation message includes the run ID, the flagged response, and the sensor readings so the reviewer can make an informed call without digging through raw logs.
The practical limitation. Logprob-based hallucination detection has high specificity but low sensitivity — it catches confident-sounding hallucinations and misses plausible ones. Supplement with application-layer checks: if the agent operates in a domain with a known knowledge base, run an automatic cross-reference of the output against the knowledge base and flag any statement the knowledge base contradicts.
Cost-Per-Run Tracking
Token-volume dashboards tell you aggregate spend but hide the per-session and per-user cost distribution. A single user session that loops through a tool-call failure five times before succeeding can cost 10× the median session; without per-run cost attribution, you pay for that inefficiency silently.
What to log. For each completed run, log the total prompt tokens, total completion tokens, tokens consumed by each model call, tokens consumed by tool-call result re-injection, and the calculated cost based on your provider’s tiered pricing. Tag the run with the triggering user, the feature context (chat, summarisation, classification), and the agent version.
What to alert on. A run whose cost exceeds 5× the p90 cost for its feature category should trigger a cost anomaly alert. Include the run ID and the breakdown of which stage consumed the most tokens. A pattern where users in a specific cohort or using a specific feature consistently exceed the anomaly threshold points to a prompt engineering or agent design problem that no amount of throttling will fix.
Storing cost data. Cost-per-run data belongs in a time-series database alongside your performance metrics, not in the application database or the inference log. Run a daily aggregation that joins cost-per-run with user-segment data to produce a cost-per-segment report. A rising cost-per-segment for the “customer support” feature without a corresponding rise in resolved tickets means your agent is burning tokens without closing cases — a prompt optimisation target, not a cost-control target.
Human-Review Escalation Logs
Every escalation matters: when an agent escalates to a human — whether triggered by low-confidence output, a sensitive action (financial transaction, account deletion), or a user explicitly requesting a human — the escalation event itself must be fully auditable.
What to log. The escalation trigger (which sensor or rule fired), the full conversation history up to the escalation point, the agent’s proposed action or response, the human reviewer’s decision (approve, reject, modify), and the post-escalation outcome. Each escalation gets its own escalation ID linked to the parent run ID.
What to alert on. A human reviewer rejecting more than 20 % of escalations from a specific agent version or feature suggests the agent is either escalating too aggressively (wasting human time) or producing outputs the reviewer consistently overrides (indicating a quality gap). Alert on that ratio per agent version and trigger a prompt or model review.
The human-review log is also your best source of training data for improving the agent. Every rejection and modification is a labelled correction. Export the escalation log weekly and use it as a fine-tuning or few-shot example dataset.
Decision Framework: Your First Observability Pass
If you are starting from zero, implement these five instrumentation points in order:
| Priority | Instrumentation | Time to Implement | First Signal You Get |
|---|---|---|---|
| 1 | Run ID + trace propagation | 1–2 days | You can replay any user session |
| 2 | Tool-call latency logging | 1 day | You see which tools fail and why |
| 3 | Cost-per-run attribution | 2–3 days | You see which users and features cost the most |
| 4 | Human-escalation audit log | 1 day | You measure review accuracy and rejection patterns |
| 5 | Hallucination risk sensors | 3–5 days | You catch a fraction of hallucinated outputs before the user does |
Priority 1 and 2 together eliminate the “we have no idea what happened” class of incidents. Priority 3 prevents the cost surprise on the monthly invoice. Priority 4 and 5 build toward a self-improving agent system where escalations produce labelled training data and hallucination alerts surface risk before the user reports it.
Conclusion
Observability for AI agents is not a monitoring add-on — it is the infrastructure that makes agent behaviour auditable, debuggable, and improvable. Instrument the five surfaces above (trace propagation, tool latency, hallucination risk, cost attribution, human escalation), set the threshold alerts, and your team’s first question after an incident shifts from “what happened” to “what do we fix first.”
Related areas
Related What I Do
These What I Do pages are matched from the subject matter of this article, creating a cleaner path from educational content to implementation work.
Continue reading
Related articles
Based on shared categories first, then the strongest overlap in tags.